

Blog
How to Build Your First Financial Model in Excel?

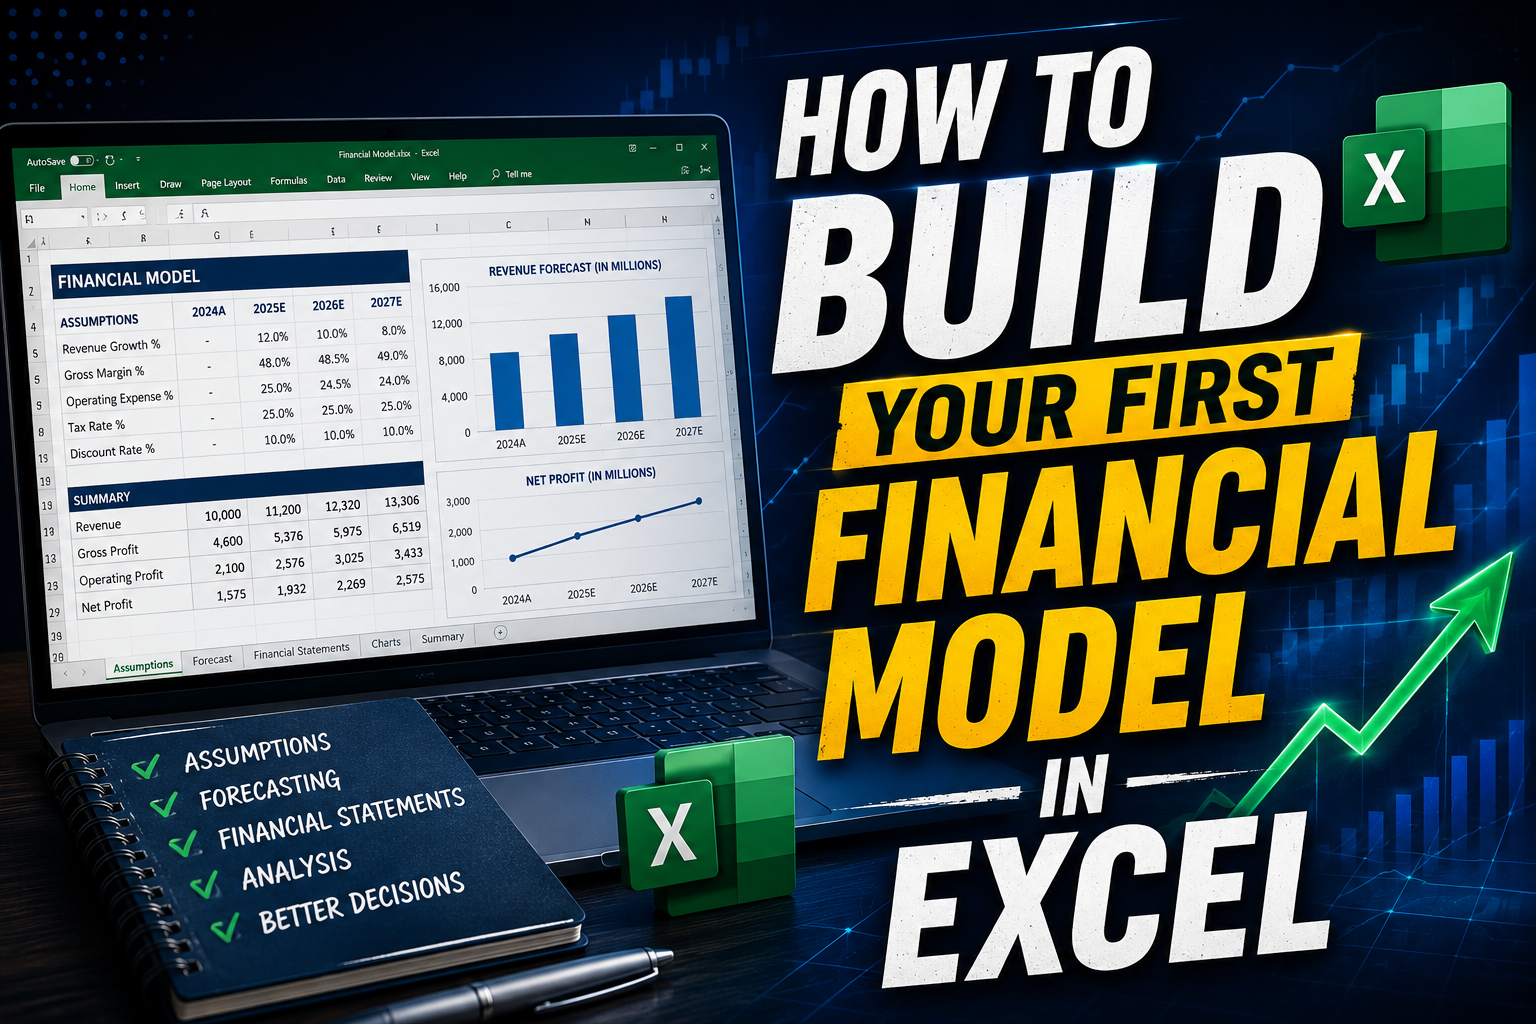
If you’ve ever watched an investment banker, equity research analyst or corporate finance professional work, you’ve probably noticed one thing they all have in common.
A spreadsheet is almost always open.
Rows.
Columns.
Charts.
Financial statements.
Forecasts.
At first glance, it looks intimidating.
But here’s the truth.
Every sophisticated financial model starts with something surprisingly simple—a blank Excel worksheet.
The biggest mistake many commerce students make is assuming financial modeling is only for experienced finance professionals. In reality, everyone begins with the basics. Learning how to build your first financial model is much like learning to ride a bicycle. It feels unfamiliar at first, but with practice, the process becomes second nature.
If you’re a commerce, CA or CMA student, mastering financial modeling in Excel can significantly improve your career opportunities. Investment banks, private equity firms, consulting companies, FP&A teams and corporate finance departments all rely heavily on Excel-based financial models.
Let’s build your first one together.
What Is Financial Modeling in Excel?
Financial modeling in Excel is the process of creating a spreadsheet that represents a company’s financial performance.
The model combines:
- Historical financial data
- Business assumptions
- Forecast calculations
- Financial statements
- Charts and analysis
Its purpose is to estimate how a business might perform in the future.
Companies use these models before making important financial decisions.
Why Excel Is Still the Industry Standard?
Despite the rise of AI tools and advanced analytics software, Microsoft Excel remains the preferred platform for financial modeling.
Why?
Because Excel offers:
- Flexibility
- Speed
- Powerful formulas
- Easy customization
- Financial analysis tools
- Visualization features
Nearly every finance professional works with Excel daily.
Learning it early provides a long-term career advantage.
Why Commerce Students Should Learn Financial Modeling in Excel?
Commerce education teaches financial concepts.
Excel helps students apply them.
Instead of simply studying accounting or finance, students learn how businesses use those concepts to make decisions.
Financial modeling develops:
- Analytical thinking
- Problem-solving
- Business understanding
- Decision-making skills
It transforms theory into practical experience.
Before You Start
You don’t need advanced finance knowledge.
A basic understanding of these topics is enough.
- Financial Statements
- Revenue
- Expenses
- Profit
- Cash Flow
- Excel Basics
As your knowledge grows, your models will naturally become more sophisticated.
Step 1: Collect Historical Financial Data
Every financial model starts with historical information.
Download the company’s:
- Income Statement
- Balance Sheet
- Cash Flow Statement
Annual reports are usually the best source.
Use at least three years of historical data whenever possible.
Example:
| Year | Revenue | Net Profit |
|---|---|---|
| 2023 | $8.5 Million | $950,000 |
| 2024 | $9.8 Million | $1.2 Million |
| 2025 | $11.1 Million | $1.5 Million |
Historical trends provide the foundation for forecasting.
Step 2: Organize Your Excel Workbook
Professional models are well organized.
A simple structure might include separate worksheets for:
- Assumptions
- Historical Data
- Forecast
- Financial Statements
- Charts
- Valuation
Keeping sections separate makes the model easier to update and review.
Step 3: Build the Assumptions Sheet
Assumptions drive the entire model.
Typical assumptions include:
- Revenue Growth
- Gross Margin
- Operating Expenses
- Tax Rate
- Interest Rate
- Capital Expenditure
Instead of typing numbers throughout the workbook, reference the assumption sheet.
This makes future updates much easier.
Step 4: Forecast Revenue
Revenue usually drives every other calculation.
Suppose last year’s revenue was $10 million.
If expected growth is 12%, Excel calculates the forecast automatically.
Example:
| Year | Revenue Growth | Forecast Revenue |
|---|---|---|
| 2025 | — | $10,000,000 |
| 2026 | 12% | $11,200,000 |
| 2027 | 10% | $12,320,000 |
Simple assumptions can create meaningful forecasts.
Step 5: Forecast Expenses
Next, estimate operating expenses.
Common categories include:
- Salaries
- Marketing
- Rent
- Utilities
- Technology
- Administrative Costs
Some expenses increase with revenue.
Others remain relatively fixed.
Understanding this difference improves model accuracy.
Step 6: Calculate Operating Profit
Once revenue and expenses are forecasted, calculate operating profit.
Operating Profit = Revenue – Operating Expenses
This helps evaluate whether the business remains profitable as it grows.
Step 7: Forecast Net Profit
Next, include:
- Interest Expense
- Taxes
- Other Income
This produces estimated Net Profit.
Net Profit is one of the most closely watched business metrics.
Step 8: Build Cash Flow Projections
Profit doesn’t always equal cash.
That’s why cash flow forecasting is essential.
Estimate:
- Operating Cash Flow
- Investing Cash Flow
- Financing Cash Flow
Healthy businesses require both profits and positive cash flow.
Step 9: Create Charts
Visuals make financial models easier to understand.
Useful charts include:
- Revenue Growth
- Profit Trend
- Cash Flow
- Expense Breakdown
- Margin Analysis
Decision-makers often understand charts faster than large tables.
Step 10: Test Different Scenarios
Businesses rarely follow a single path.
Professional models evaluate multiple scenarios.
Examples include:
Base Case
Expected business performance.
Best Case
Higher revenue and stronger margins.
Worst Case
Lower sales and higher costs.
Scenario analysis helps businesses prepare for uncertainty.
Essential Excel Functions Every Beginner Should Learn
Financial models become much easier once you understand a few important Excel functions.
| Function | Purpose |
|---|---|
| SUM | Add values |
| AVERAGE | Calculate averages |
| IF | Logical calculations |
| XLOOKUP | Retrieve information |
| INDEX + MATCH | Flexible lookups |
| ROUND | Improve presentation |
| PMT | Loan calculations |
| NPV | Investment evaluation |
You don’t need hundreds of formulas.
Mastering a few key functions is enough to begin.
Best Practices for Building Financial Models
Professional models share several characteristics.
They are:
- Easy to read
- Clearly labelled
- Consistent
- Error-free
- Flexible
- Well documented
Simple models are usually more valuable than complicated ones.
Common Mistakes Beginners Make
Many students struggle because they:
- Hardcode numbers instead of using formulas.
- Mix assumptions with calculations.
- Ignore formatting consistency.
- Use unrealistic forecasts.
- Forget to check formulas.
- Build unnecessarily complex models.
Avoiding these mistakes will save countless hours later.
How Financial Models Are Used in Different Careers?
Financial modeling isn’t limited to investment banking.
It supports many finance careers.
| Career | How Models Are Used |
|---|---|
| Investment Banking | IPOs, M&A, fundraising |
| Equity Research | Company valuation |
| Private Equity | Investment decisions |
| Corporate Finance | Business planning |
| FP&A | Budgeting and forecasting |
| Consulting | Strategic recommendations |
| Commercial Banking | Credit analysis |
| Startups | Business planning |
The same skill applies across multiple industries.
Why CA & CMA Students Have an Advantage?
Students pursuing CA and CMA already understand:
- Accounting
- Financial Reporting
- Cost Management
- Corporate Finance
- Taxation
Excel modeling allows them to convert this technical knowledge into practical business analysis.
Employers highly value candidates who can do both.
Learning Roadmap for Beginners
If you’re starting from scratch, follow this sequence.
Week 1
- Learn Excel basics.
- Practice formulas.
- Understand formatting.
Week 2
- Study financial statements.
- Download annual reports.
Week 3
- Build a simple revenue forecast.
- Estimate expenses.
Week 4
- Create a complete three-year financial model.
- Add charts.
- Review assumptions.
Progress matters more than perfection.
Practical Exercise
Choose a listed company.
Download its latest annual report.
Create a simple Excel workbook containing:
| Worksheet | Objective |
|---|---|
| Historical Data | Record past financial statements |
| Assumptions | Revenue growth and expense estimates |
| Forecast | Project the next three years |
| Charts | Visualize business performance |
Don’t worry if the first version isn’t perfect.
Professional financial modelers improve their models constantly.
Frequently Asked Questions (FAQs)
What is financial modeling in Excel?
Financial modeling in Excel is the process of creating spreadsheet-based financial forecasts that help businesses evaluate future performance and support decision-making.
Is Excel enough to learn financial modeling?
Yes. Microsoft Excel remains the primary software used by investment banks, corporate finance teams, consulting firms and equity research analysts for financial modeling.
Why should commerce students learn financial modeling?
Financial modeling helps commerce students apply accounting and finance concepts to real-world business situations while preparing for careers in investment banking, FP&A, equity research and corporate finance.
What Excel skills are required for financial modeling?
Students should learn formulas, IF functions, XLOOKUP, INDEX-MATCH, Pivot Tables, charts, formatting, keyboard shortcuts and financial functions.
Can CA students learn financial modeling easily?
Yes. Since CA students already understand accounting and financial reporting, learning Excel-based financial modeling becomes much easier.
How long does it take to build your first financial model?
Most beginners can create a basic financial model within a few weeks of consistent practice. More advanced models develop gradually with experience.
