

Blog
Power BI for Finance Professionals: A Beginner’s Guide

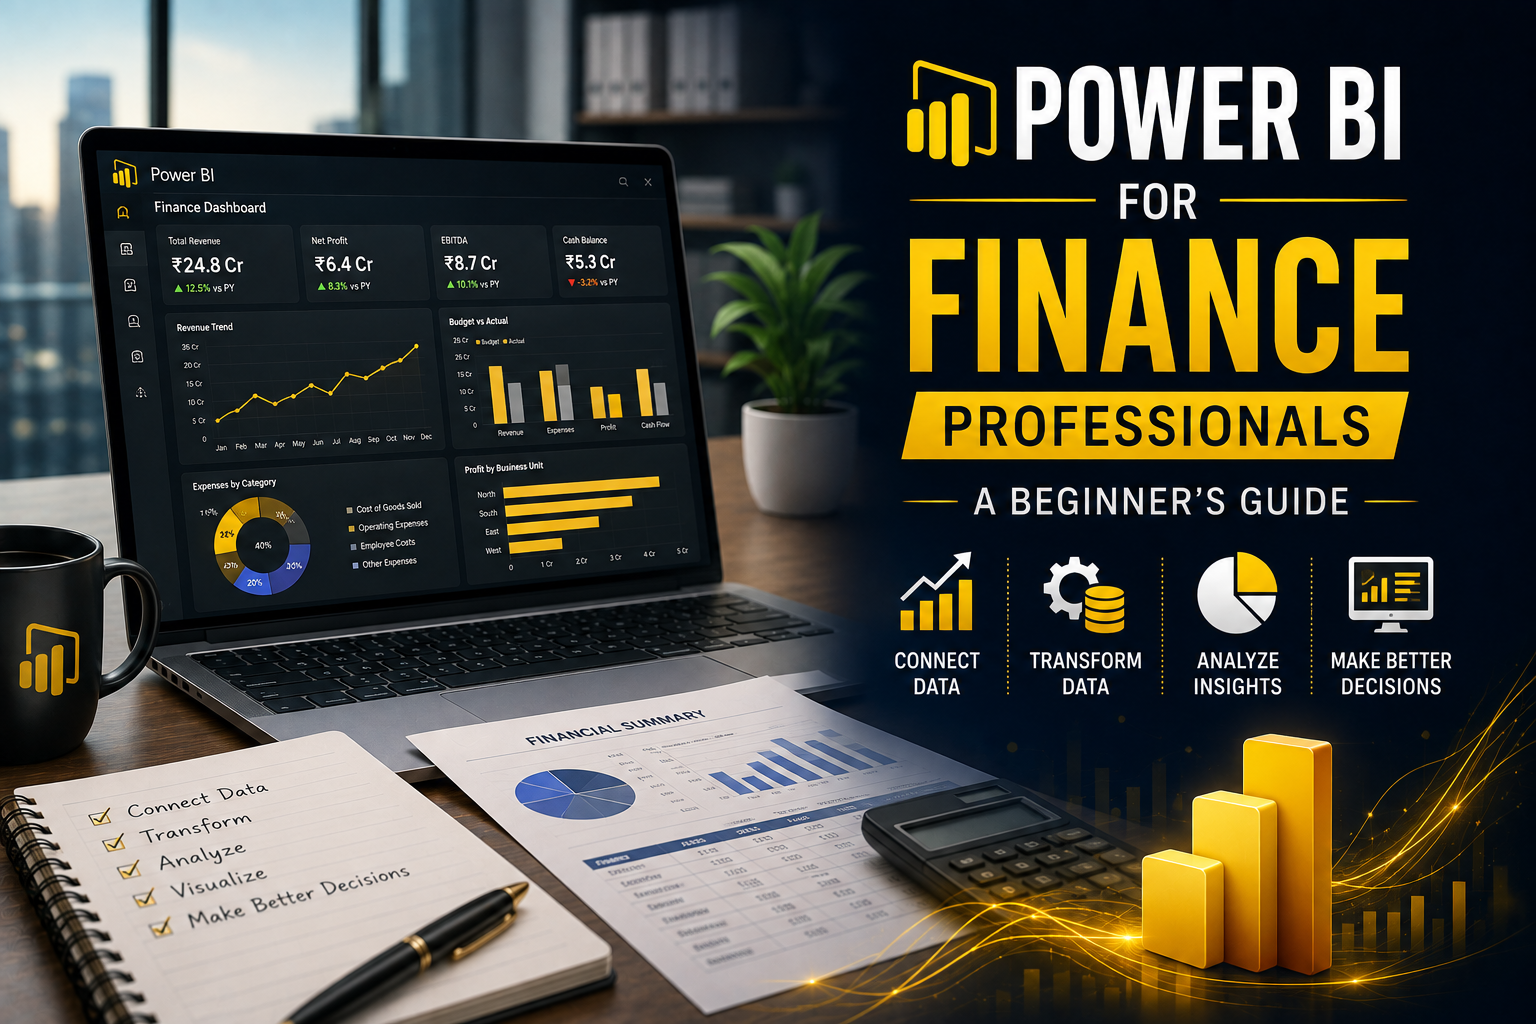
Finance has always been about numbers.
But modern finance is increasingly about what you can do with those numbers.
A finance professional may have revenue data in Excel, expenses in an ERP system, customer information in a CRM and budgets stored in different files. Looking at each source separately can make it difficult to see the bigger picture.
This is where Power BI for finance becomes useful.
Microsoft Power BI allows professionals to connect data sources, transform and model data, create interactive reports and present financial information through dashboards and visualisations. Microsoft’s current beginner learning path specifically covers connecting to data, transforming it with Power Query and creating interactive reports.
For finance professionals, the real value isn’t creating attractive charts.
It is turning financial data into information that helps people make decisions.
What Is Power BI?
Power BI is Microsoft’s business intelligence and data analytics platform.
In simple terms, it helps you move from:
Raw Data → Clean Data → Analysis → Visualisation → Business Insight
For example, imagine a company has monthly sales, expenses and budget information stored in Excel files.
Instead of manually preparing the same report every month, Power BI can connect to the data, transform it, build a data model and present the results through interactive reports.
A finance manager could then quickly examine:
- Revenue
- Expenses
- Gross profit
- Net profit
- Cash flow
- Budget vs actuals
- Profit margins
- Accounts receivable
- Accounts payable
- Business-unit performance
Microsoft’s finance-oriented Power BI examples include KPIs such as revenue, expenses, net income, gross margin, current ratio and actual-versus-budget analysis.
Why Should Finance Professionals Learn Power BI?
Excel remains extremely useful in finance.
Power BI doesn’t necessarily replace Excel.
Think of it this way:
Excel is excellent for calculation and detailed spreadsheet work.
Power BI is excellent for analysing, visualising and communicating large amounts of data.
A finance professional who can use both has a strong combination of skills.
For example, Excel might be used to build or review a detailed financial model, while Power BI could be used to turn financial and operational data into an interactive management dashboard.
That distinction matters.
How Power BI Is Used in Finance
Power BI can support many areas of financial management.
| Finance Area | Example Power BI Use |
|---|---|
| Financial Reporting | Automated management reports |
| FP&A | Budgeting and forecasting analysis |
| Accounting | Financial statement dashboards |
| Management Accounting | Cost and profitability analysis |
| Treasury | Cash and liquidity monitoring |
| Credit | Receivables and overdue analysis |
| Audit | Transaction and exception analysis |
| Corporate Finance | Performance and KPI analysis |
| Investment Analysis | Portfolio and company data visualisation |
| CFO Reporting | Executive financial dashboards |
The exact application depends on the organisation’s data and reporting processes.
Power BI vs Excel for Finance
This is one of the first questions beginners ask.
The answer isn’t really Power BI vs Excel.
They solve different problems.
| Excel | Power BI |
|---|---|
| Excellent for detailed calculations | Excellent for interactive analysis |
| Flexible spreadsheet environment | Structured reporting environment |
| Strong for financial modelling | Strong for dashboards |
| Manual analysis can be easy | Repeatable reporting can be easier |
| Great for smaller datasets and models | Designed for broader data-analysis scenarios |
| Highly flexible cell-level work | Strong data modelling and visualisation |
| Widely used by finance teams | Increasingly useful for BI and management reporting |
A practical finance workflow might actually use both.
For example:
ERP / Excel Data → Power Query → Power BI Model → Dashboard
while detailed modelling or ad-hoc calculations may continue in Excel.
The Power BI Workflow for Finance
A beginner should understand the basic workflow before worrying about advanced features.
Step 1: Connect to Data
Power BI can connect to many different data sources.
These can include:
- Excel
- CSV files
- SQL databases
- Cloud services
- Business applications
- Other structured data sources
Microsoft’s current Power BI documentation describes connecting to sources including Excel, relational databases and NoSQL sources.
For a finance professional, the starting point could be something as simple as an Excel workbook containing monthly financial information.
Step 2: Clean the Data
Raw financial data is rarely perfect.
You may encounter:
- Blank rows
- Duplicate records
- Incorrect data types
- Inconsistent account names
- Different date formats
- Unnecessary columns
- Missing values
Power Query is used within Power BI to prepare and transform data.
This step is more important than beginners often realise.
A beautiful dashboard built on poor data is still a poor report.
Step 3: Build a Data Model
After cleaning the data, you need to structure it properly.
This is where data modelling becomes important.
Imagine you have:
- Sales transactions
- Customer information
- Product information
- Calendar data
- Region information
Rather than putting everything into one giant table, Power BI can use relationships between tables.
Understanding this concept is one of the biggest steps from beginner to competent Power BI user.
Step 4: Create Measures
Measures are calculations that respond dynamically to the data being analysed.
Finance professionals may create measures for:
- Total Revenue
- Total Expenses
- Gross Profit
- EBITDA
- Net Profit
- Gross Margin %
- Operating Margin %
- Budget Variance
- Revenue Growth %
- Year-to-Date Revenue
DAX, or Data Analysis Expressions, is used to create calculations in Power BI.
You don’t need to learn hundreds of DAX functions initially.
Start with the concepts.
Step 5: Build Visualisations
Now the data becomes easier to understand.
You can create:
- Bar charts
- Line charts
- Tables
- Cards
- KPI visuals
- Matrix reports
- Maps
- Slicers
- Waterfall charts
For finance reporting, visualisation should answer questions rather than simply make the dashboard look impressive.
For example:
Revenue increased. Why?
Expenses exceeded budget. Where?
Which business unit is most profitable?
Which customers are overdue?
Those are useful questions.
Important Finance KPIs to Track in Power BI
A finance dashboard could contain dozens of metrics, but more isn’t always better.
Some commonly useful KPIs include:
Revenue
Shows how much income the business generates from its operations.
Gross Profit
Helps assess profitability after direct costs.
Gross Margin
Useful for understanding profitability relative to revenue.
Operating Expenses
Tracks the costs required to operate the business.
EBITDA
Often used as an operating performance measure, although its usefulness depends on the context and reporting purpose.
Net Profit
Shows the profit remaining after relevant expenses.
Cash Balance
A basic but critical indicator of liquidity.
Accounts Receivable
Shows outstanding customer amounts.
Accounts Payable
Shows amounts owed to suppliers and other parties.
Current Ratio
Provides an indication of short-term liquidity.
Budget Variance
Shows how actual performance differs from budget.
Microsoft’s finance analytics examples include metrics such as net profit margin, gross profit margin, current/quick/cash ratios, debt-to-equity, EBITDA and average collection period.
Budget vs Actual Analysis
One of the most useful applications of Power BI for finance is budget-versus-actual analysis.
Suppose the annual marketing budget is ₹1 crore.
After six months:
Budget: ₹50 lakh
Actual: ₹62 lakh
The difference is immediately visible.
But the more important question is:
Why is there a ₹12 lakh variance?
Power BI can help finance teams drill into the data by:
- Department
- Location
- Month
- Expense category
- Business unit
- Cost centre
This turns a basic variance report into an investigation tool.
Microsoft’s current finance reporting examples include dedicated budget-versus-actual reporting to help identify areas where spending is aligned with expectations and areas requiring attention.
Financial Statement Dashboards
Power BI can also be used to present financial statement information.
A management dashboard might include:
Profit & Loss
- Revenue
- Cost of goods sold
- Gross profit
- Operating expenses
- Operating profit
- Net profit
Balance Sheet
- Assets
- Liabilities
- Equity
- Working capital
- Debt
Cash Flow
- Operating cash flow
- Investing cash flow
- Financing cash flow
- Cash balance
The advantage is that users can often interact with the report rather than simply receiving a static spreadsheet.
For example, a CFO might want to view results by:
Company → Region → Business Unit → Department
That level of interaction is where Power BI becomes particularly useful.
Power BI for FP&A Professionals
Financial Planning & Analysis is a natural area for Power BI.
FP&A teams spend significant time working with:
- Budgets
- Forecasts
- Actual results
- Variance analysis
- Management reporting
- Scenario analysis
- Performance metrics
Power BI can bring these datasets together into a reporting environment.
A dashboard could show:
Actual Revenue | Budget | Variance | Forecast
Then allow the user to filter the information by month, region, product or business unit.
Microsoft has also introduced finance-oriented planning experiences in Power BI that connect revenue, workforce, operating expense and capital investment planning scenarios.
Power BI for CFO Dashboards
CFOs don’t necessarily need to see every transaction.
They need to understand what is happening.
A CFO dashboard might focus on:
- Revenue growth
- Gross margin
- EBITDA
- Cash position
- Working capital
- Receivables
- Payables
- Debt
- Budget variance
- Forecast
- Business-unit profitability
Microsoft’s CFO-oriented Power BI content includes financial performance, cash overview, sales and profitability, credit and collections and purchasing analysis.
The goal is simple:
Put the right information in front of the decision-maker.
Power BI for Accounts Receivable
Accounts receivable is another practical use case.
A finance team may want to know:
- How much money is outstanding?
- Which customers owe the most?
- How long have invoices been overdue?
- Which customers are approaching credit limits?
- How has collection performance changed?
A dashboard can turn a long receivables report into something easier to investigate.
For example:
Total Receivables → Overdue Receivables → Top Overdue Customers → Ageing Analysis
This can help collection teams focus their attention.
Power BI for Cash Flow Analysis
Cash flow deserves special attention.
A profitable company can still experience cash problems.
Power BI can help finance professionals monitor:
- Cash balances
- Receipts
- Payments
- Operating cash flow
- Cash forecasts
- Bank balances
- Currency exposure
Microsoft’s finance analytics examples include cash-flow forecasts and bank-account balance reporting.
This can be particularly valuable when management wants a quick view of liquidity.
Learning DAX for Finance
DAX can initially look intimidating.
It doesn’t have to be.
Start with simple concepts.
For example, a finance professional should understand how to create calculations for:
- Total revenue
- Total expenses
- Profit
- Margin
- Year-to-date performance
- Prior-year comparisons
- Growth rates
- Variances
Then gradually move into more advanced calculations.
The important thing is to learn DAX through finance problems.
Instead of memorising functions, ask:
“How do I calculate this financial metric?”
That’s a much better way to learn.
Power Query: A Must-Learn Skill
If you are serious about Power BI for finance, don’t skip Power Query.
Power Query is used for data preparation and transformation.
Imagine receiving 12 monthly Excel files with the same structure.
Instead of manually cleaning each file, you can create a repeatable transformation process.
This is one of the reasons Power BI can reduce repetitive reporting work.
Microsoft’s beginner Power BI training specifically includes basic data preparation using Power Query.
How Power BI Can Improve Finance Reporting
Traditional reporting can sometimes involve a cycle like:
Collect files → Copy data → Clean data → Create formulas → Update charts → Check numbers → Send report
Every month.
And every manual step creates an opportunity for error.
A properly designed Power BI reporting process can automate much of the repetitive transformation and presentation work.
That doesn’t mean finance professionals become unnecessary.
Quite the opposite.
The less time spent preparing reports, the more time can potentially be spent understanding what the numbers mean.
That’s the real benefit.
Power BI Skills Finance Professionals Should Learn
A useful learning roadmap looks like this:
| Level | Skills |
|---|---|
| Beginner | Power BI interface, importing data, basic visuals |
| Intermediate | Power Query, relationships, filters, slicers |
| Advanced Beginner | DAX measures, data modelling, financial KPIs |
| Intermediate | Dashboards, time intelligence, drill-through |
| Advanced | Advanced DAX, optimisation, governance and enterprise reporting |
Don’t try to learn everything at once.
Build one useful dashboard.
Then improve it.
Power BI vs Tableau for Finance
Both Power BI and Tableau are established business intelligence platforms.
The right choice depends on the organisation, technology environment, data architecture and reporting requirements.
For a finance professional already working heavily with Microsoft tools such as Excel, Power BI can be a natural platform to explore.
That doesn’t mean Tableau is inferior.
It simply means the surrounding technology ecosystem matters.
Do Finance Professionals Need to Learn SQL Too?
If you’re serious about analytics, learning SQL is a very good next step.
Power BI can connect to databases, but understanding SQL helps you communicate with data more effectively.
A useful progression could be:
Excel → Power BI → SQL → Advanced Analytics
Not everyone needs advanced SQL.
But understanding:
- SELECT
- WHERE
- JOIN
- GROUP BY
- ORDER BY
can be extremely useful.
Power BI and AI
Power BI is also evolving alongside artificial intelligence.
Microsoft’s current Power BI learning resources include Copilot-related capabilities for report development and data exploration.
This creates an interesting opportunity for finance professionals.
AI may help with:
- Exploring data
- Generating report elements
- Understanding trends
- Creating narratives
- Asking questions about data
But finance professionals still need to validate the results.
AI can make analysis faster.
It doesn’t automatically make the analysis correct.
That’s an important distinction.
Common Mistakes Beginners Make
Trying to Make the Dashboard Beautiful First
A dashboard should answer business questions.
Design comes second.
Using Too Many Charts
More visuals don’t necessarily mean more insight.
A dashboard with eight useful visuals can be better than one with 25 confusing ones.
Ignoring Data Quality
If the source data is wrong, the dashboard will simply present the wrong information more attractively.
Learning DAX Without Understanding Finance
This is another common problem.
Don’t learn DAX as a programming exercise.
Learn it by solving finance problems.
Creating One Giant Table
Good data modelling matters.
Learn how tables relate to each other rather than putting everything into one enormous dataset.
Forgetting the Audience
A CFO, finance manager and analyst may need different levels of detail.
Design reports around the person who will use them.
A Beginner’s Power BI Learning Plan
If you’re starting today, this is a practical approach.
Week 1: Understand the Platform
Learn:
- What Power BI is
- Power BI Desktop
- Power BI Service
- Reports
- Dashboards
- Data sources
- Visuals
Microsoft’s beginner learning resources are designed for users with no prior Power BI experience.
Week 2: Learn Power Query
Practice:
- Importing Excel files
- Removing columns
- Changing data types
- Removing duplicates
- Filtering data
- Combining tables
Week 3: Learn Data Modelling
Understand:
- Tables
- Relationships
- Fact tables
- Dimension tables
- Calendar tables
Week 4: Learn DAX Basics
Build measures for:
- Revenue
- Expenses
- Profit
- Margin
- Growth
- Variance
Week 5: Build a Finance Dashboard
Create a dashboard containing:
- Revenue
- Expenses
- Profit
- Margin
- Budget vs actual
- Monthly trend
- Business-unit performance
Week 6: Improve It
Add:
- Filters
- Drill-through
- Better data modelling
- More useful measures
- Improved layout
- Clearer financial storytelling
Microsoft also provides an official tutorial that walks users through creating a report from an Excel financial workbook, including data preparation, visuals, slicers and publishing.
What Should Commerce Students Learn?
If you’re a B.Com, M.Com, CA, CMA or finance student, you don’t need to become a full-time data analyst.
But adding Power BI to your finance skill set can be valuable.
A strong combination would be:
Accounting + Finance + Excel + Power BI + Data Analysis
Then, depending on your career direction, you can add:
- SQL
- Python
- Financial modelling
- Power Query
- Power Pivot
- Power BI
- AI tools
This creates a much more practical skill profile.
Frequently Asked Questions
Is Power BI useful for finance professionals?
Yes. Power BI can help finance professionals analyse financial data, create dashboards, monitor KPIs, compare budgets with actual results and communicate insights.
Is Power BI difficult for finance professionals to learn?
The basics are approachable, especially for people already familiar with Excel and data. The more advanced areas, particularly DAX and data modelling, require more practice.
Should I learn Excel before Power BI?
Excel is not an absolute prerequisite, but it is highly useful. Finance professionals who understand spreadsheets, tables, formulas and financial analysis often find the transition to Power BI easier.
Is Power BI better than Excel for finance?
Neither is universally better. Excel is excellent for flexible calculations, detailed modelling and spreadsheet-based analysis. Power BI is particularly useful for interactive reporting, data visualisation and repeatable dashboards.
Do finance professionals need DAX?
If you want to create more advanced Power BI financial reports, learning DAX is highly recommended. Start with basic measures and gradually learn more advanced calculations.
Is Power BI useful for FP&A?
Yes. Budget-versus-actual analysis, forecasting, management reporting, KPI tracking and performance analysis are all relevant FP&A use cases.
Can Power BI replace financial analysts?
No. Power BI is a tool for analysis and reporting. Finance professionals still need to understand accounting, financial concepts, business drivers, risks and decision-making.
Should CA and CMA students learn Power BI?
It can be a valuable additional skill. CA and CMA students already develop financial and accounting knowledge, and Power BI can help them apply that knowledge to real-world data analysis and reporting.
Is Power BI useful for CFOs?
Yes. CFO dashboards can provide a consolidated view of revenue, profitability, cash, working capital, budgets and other financial KPIs. Microsoft provides finance-oriented Power BI examples covering many of these areas.
What should I learn after Power BI?
For finance-focused careers, useful next skills include SQL, advanced Excel, financial modelling, Power Query, data modelling and potentially Python or other analytics tools.
