

Blog
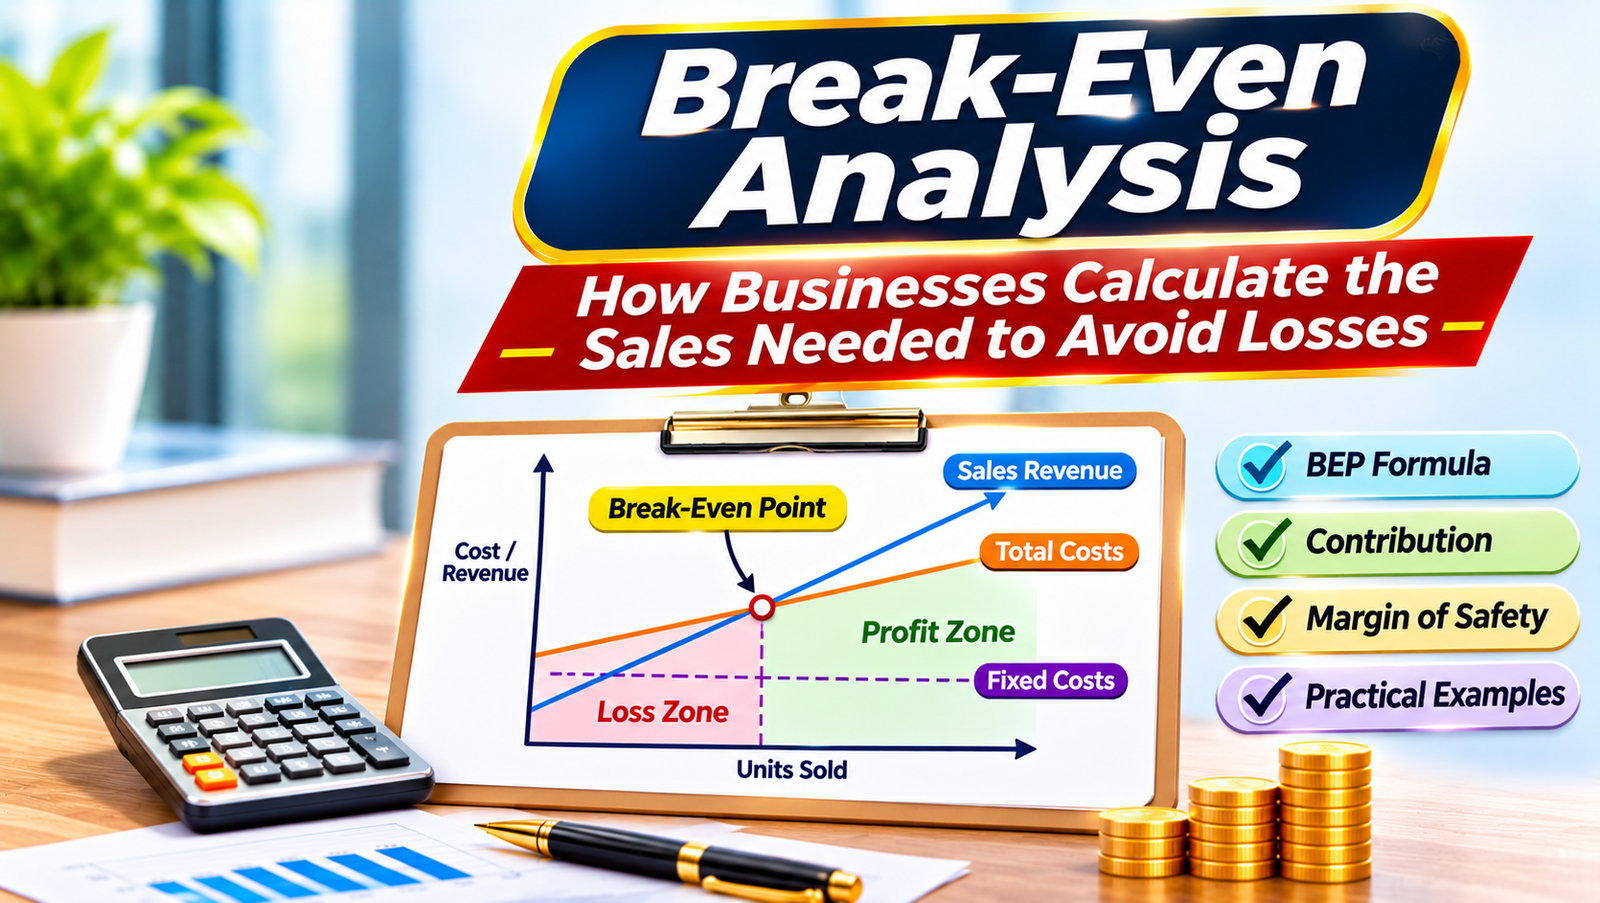
Break-Even Analysis: How Businesses Calculate the Sales Needed to Avoid Losses

A small manufacturing company sells a product for ₹500. Its variable cost is ₹300 per unit, and it spends ₹2,00,000 every month on fixed expenses.
How many units must the company sell before it starts earning a profit?
The answer is 1,000 units. At this sales level, the company earns enough contribution to cover its fixed costs, resulting in neither profit nor loss.
This calculation is called break-even analysis.
Understanding break even analysis with examples helps CA, CMA and commerce students learn how businesses determine minimum sales targets, evaluate pricing decisions and understand the relationship between costs, sales and profit.
Break-even analysis is a part of cost-volume-profit (CVP) analysis. It identifies the sales volume or revenue at which total revenue equals total costs.
What Is Break-Even Analysis?
Break-even analysis is a financial technique used to calculate the level of sales at which a business covers all its fixed and variable costs without making a profit or loss.
The sales level at which this happens is called the break-even point (BEP).
At the break-even point:
Total Revenue = Total Costs
Therefore:
Profit = ₹0
For example, suppose a bakery has monthly fixed costs of ₹60,000. It sells cakes for ₹500 each, and the variable cost of making and selling each cake is ₹300.
The contribution per cake is ₹200.
To recover ₹60,000 in fixed costs, the bakery must sell:
₹60,000 ÷ ₹200 = 300 cakes
Selling 300 cakes allows the bakery to break even.
Selling more than 300 cakes generates profit, assuming the selling price, variable cost per unit and fixed costs remain unchanged.
Important Components of Break-Even Analysis
Before calculating the break-even point, students should understand four important concepts.
1. Fixed Costs
Fixed costs are expenses that remain constant in total within a relevant range of business activity.
Examples include:
- Factory rent.
- Salaries of permanent administrative staff.
- Factory insurance.
- Depreciation calculated using a time-based method.
- Other fixed operating overheads.
Suppose a company pays ₹50,000 in monthly factory rent.
Whether it produces 500 units or 1,000 units, the rent remains ₹50,000, assuming no change in the rental arrangement or capacity requirements.
However, fixed costs can increase when a business expands beyond its existing capacity.
2. Variable Costs
Variable costs change in total with production or sales volume.
Examples include:
- Raw materials.
- Piece-rate production wages.
- Variable packaging costs.
- Sales commissions.
- Other costs that vary with activity.
If the variable cost of manufacturing one product is ₹150, producing 1,000 units costs ₹1,50,000.
Producing 2,000 units costs ₹3,00,000, assuming the variable cost per unit remains constant.
3. Selling Price
The selling price is the amount charged to customers for each unit.
It directly affects the contribution earned from every sale.
A higher selling price generally increases contribution per unit when variable costs remain unchanged.
However, a price increase may reduce customer demand, so businesses must consider both price and expected sales volume.
4. Contribution
Contribution is the amount remaining after deducting variable costs from sales revenue.
Contribution = Sales − Variable Costs
For one unit:
Contribution per Unit = Selling Price per Unit − Variable Cost per Unit
Contribution first covers fixed costs. Any amount remaining after fixed costs are recovered becomes profit.
Break-Even Point Formula
The break-even point can be calculated in units or sales value.
Break-Even Point in Units
Break-Even Point (Units) = Fixed Costs ÷ Contribution per Unit
Where:
Contribution per unit = Selling price per unit − Variable cost per unit
Break-Even Point in Sales Value
Break-Even Sales = Fixed Costs ÷ Contribution Margin Ratio
The contribution margin ratio, also called the P/V Ratio, is calculated as:
P/V Ratio = (Contribution ÷ Sales) × 100
When using the percentage form, the break-even sales formula becomes:
Break-Even Sales = (Fixed Costs × 100) ÷ P/V Ratio (%)
These formulas assume a positive contribution margin and a stable cost structure within the relevant activity range.
Break-Even Analysis with a Practical Business Example
Consider ABC Furniture Pvt. Ltd., a fictional company manufacturing office chairs.
The company has the following monthly cost structure.
| Particulars | Amount |
|---|---|
| Selling price per chair | ₹2,000 |
| Variable cost per chair | ₹1,200 |
| Monthly fixed costs | ₹4,00,000 |
Management wants to determine the number of chairs it must sell every month to avoid losses.
Step 1: Calculate Contribution per Unit
Contribution per chair:
₹2,000 − ₹1,200 = ₹800
Each chair contributes ₹800 towards recovering fixed costs and generating profit.
Step 2: Calculate the Break-Even Point
Break-even point:
₹4,00,000 ÷ ₹800 = 500 chairs
ABC Furniture must sell 500 chairs to cover its total costs.
Step 3: Calculate Break-Even Sales Revenue
Break-even sales:
500 × ₹2,000 = ₹10,00,000
The company needs monthly sales revenue of ₹10 lakh to break even.
Step 4: Verify the Calculation
| Particulars | Amount |
|---|---|
| Sales Revenue (500 × ₹2,000) | ₹10,00,000 |
| Less: Variable Costs (500 × ₹1,200) | ₹6,00,000 |
| Contribution | ₹4,00,000 |
| Less: Fixed Costs | ₹4,00,000 |
| Profit / Loss | ₹0 |
The calculation confirms that the company breaks even at 500 chairs.
At this point, its contribution exactly covers its fixed costs.
How Sales Volume Affects Profit and Loss?
Once the break-even point is known, management can estimate profit at different sales volumes.
Consider the same furniture company.
- Selling price: ₹2,000 per chair.
- Variable cost: ₹1,200 per chair.
- Contribution: ₹800 per chair.
- Fixed costs: ₹4,00,000.
| Chairs Sold | Sales Revenue | Total Contribution | Profit / Loss |
|---|---|---|---|
| 200 | ₹4,00,000 | ₹1,60,000 | −₹2,40,000 |
| 300 | ₹6,00,000 | ₹2,40,000 | −₹1,60,000 |
| 400 | ₹8,00,000 | ₹3,20,000 | −₹80,000 |
| 500 | ₹10,00,000 | ₹4,00,000 | ₹0 |
| 600 | ₹12,00,000 | ₹4,80,000 | ₹80,000 |
| 800 | ₹16,00,000 | ₹6,40,000 | ₹2,40,000 |
| 1,000 | ₹20,00,000 | ₹8,00,000 | ₹4,00,000 |
The company starts generating profit after selling more than 500 chairs.
Every additional chair sold contributes ₹800 towards profit, assuming fixed costs do not increase and the contribution per unit remains unchanged.
This helps management estimate how changes in sales volume affect profitability.
Understanding the Break-Even Chart
A break-even chart visually represents the relationship between sales revenue, total costs and production volume.
The horizontal axis shows the number of units sold.
The vertical axis shows revenue and costs.
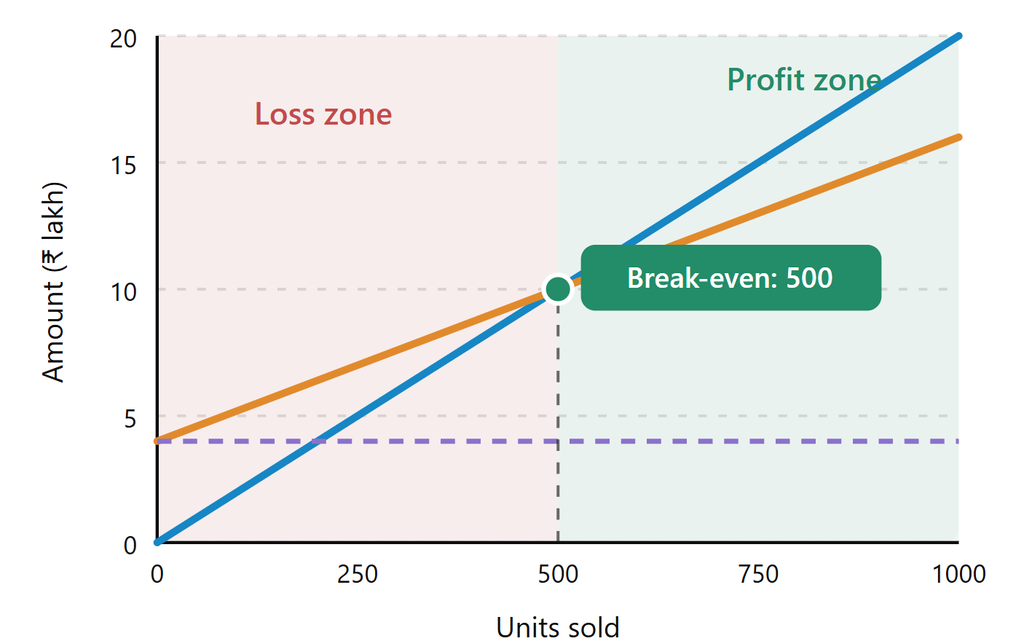
The point where the total revenue line intersects the total cost line is the break-even point.
To the left of this point, the business operates at a loss. To the right, it earns a profit under the assumed cost and revenue relationships.
How Changes in Selling Price Affect Break-Even Sales?
Selling price directly influences the break-even point.
Suppose ABC Furniture reduces its selling price from ₹2,000 to ₹1,800 to attract more customers.
Variable cost remains ₹1,200 per chair.
New contribution per unit:
₹1,800 − ₹1,200 = ₹600
New break-even point:
₹4,00,000 ÷ ₹600 = 666.67 chairs
Since the company cannot sell a fraction of a chair, it must sell at least 667 chairs to avoid a loss.
Previously, it needed to sell only 500 chairs.
The price reduction increases the minimum sales requirement by 167 chairs.
Management must determine whether the lower price can realistically generate enough additional demand.
How Fixed Costs Affect the Break-Even Point?
Fixed costs also influence the minimum sales volume required.
Suppose ABC Furniture moves into a larger factory.
Its monthly fixed costs increase from ₹4,00,000 to ₹5,60,000.
Contribution per chair remains ₹800.
New break-even point:
₹5,60,000 ÷ ₹800 = 700 chairs
The company now needs to sell 700 chairs instead of 500.
This illustrates why business expansion should be evaluated alongside expected sales growth.
A larger factory may increase production capacity, but the business must generate sufficient additional contribution to recover its higher fixed costs.
How Variable Costs Affect Break-Even Sales?
Variable costs can change because of raw material prices, wages, packaging costs and production efficiency.
Suppose the variable cost of each chair increases from ₹1,200 to ₹1,400.
Selling price remains ₹2,000.
New contribution per chair:
₹2,000 − ₹1,400 = ₹600
Break-even point:
₹4,00,000 ÷ ₹600 = 666.67 chairs
The company must sell at least 667 chairs to avoid a loss.
Comparison of Different Business Scenarios
| Scenario | Contribution per Unit | Fixed Costs | Break-Even Units |
|---|---|---|---|
| Original situation | ₹800 | ₹4,00,000 | 500 |
| Selling price reduced | ₹600 | ₹4,00,000 | 667 |
| Fixed costs increased | ₹800 | ₹5,60,000 | 700 |
| Variable cost increased | ₹600 | ₹4,00,000 | 667 |
<text color=”secondary” size=”xs”>Break-even units are rounded up to the next whole unit where necessary.</text>
The comparison shows that break-even analysis is not simply about finding one sales target. It helps management understand how changes in business conditions affect profitability.
How to Calculate Sales Needed to Achieve a Target Profit
Businesses often want to earn a specific profit rather than merely break even.
The target profit formula is:
Required Sales Units = (Fixed Costs + Target Profit) ÷ Contribution per Unit
Suppose ABC Furniture wants to earn ₹2,00,000 per month.
Its fixed costs are ₹4,00,000 and contribution per chair is ₹800.
Required sales:
(₹4,00,000 + ₹2,00,000) ÷ ₹800
= 750 chairs
The company must sell 750 chairs to earn the desired operating profit of ₹2 lakh.
Verification
| Particulars | Amount |
|---|---|
| Sales Revenue (750 × ₹2,000) | ₹15,00,000 |
| Variable Costs (750 × ₹1,200) | ₹9,00,000 |
| Contribution | ₹6,00,000 |
| Fixed Costs | ₹4,00,000 |
| Operating Profit | ₹2,00,000 |
This calculation helps businesses establish sales targets based on their profit objectives.
What Is Margin of Safety?
Margin of safety measures how much actual or budgeted sales exceed break-even sales.
It indicates the amount by which sales can fall before the business reaches its break-even point.
Margin of Safety = Actual Sales − Break-Even Sales
Suppose ABC Furniture sells 800 chairs per month.
Its break-even point is 500 chairs.
Margin of safety:
800 − 500 = 300 chairs
Margin of safety percentage:
(300 ÷ 800) × 100 = 37.5%
This means sales could fall by 37.5% from the current level before reaching break-even, assuming the existing cost structure remains unchanged.
A higher margin of safety generally provides a greater cushion against unexpected declines in sales.
Break-Even Analysis for a Business Selling Multiple Products
Many businesses sell more than one product.
For example, a furniture manufacturer may sell office chairs, desks and storage cabinets.
Each product may have a different selling price and contribution margin.
In such situations, break-even analysis can use a weighted-average contribution margin based on the expected sales mix.
Practical Example
Suppose a company sells two products.
| Particulars | Product A | Product B |
|---|---|---|
| Selling price | ₹500 | ₹800 |
| Variable cost | ₹300 | ₹500 |
| Contribution per unit | ₹200 | ₹300 |
| Expected sales mix | 2 units | 1 unit |
The expected sales mix is two units of Product A for every one unit of Product B.
Contribution per sales-mix bundle:
(2 × ₹200) + (1 × ₹300)
= ₹700
Assume monthly fixed costs are ₹1,40,000.
Break-even bundles:
₹1,40,000 ÷ ₹700 = 200 bundles
Therefore, the company must sell:
- Product A: 400 units.
- Product B: 200 units.
Total break-even sales:
(400 × ₹500) + (200 × ₹800)
= ₹3,60,000
This calculation assumes the expected 2:1 sales mix remains constant.
If customers purchase products in different proportions, the actual break-even point may change.
How Businesses Use Break-Even Analysis?
Break-even analysis supports several practical management decisions.
Pricing decisions: Businesses can estimate how a price increase or discount affects the sales volume required to cover costs.
Business expansion: Management can evaluate whether additional fixed costs from a new factory, shop or production line can be recovered.
Product launches: Companies can estimate how many units of a new product must be sold to avoid an operating loss.
Sales planning: Break-even calculations help establish minimum sales targets and evaluate profit objectives.
Cost control: Businesses can examine whether reducing variable costs or fixed expenses would improve profitability.
However, break-even analysis should be used alongside market demand, cash flow, capacity and other financial information.
Limitations of Break-Even Analysis
Break-even analysis is useful, but its results depend on several assumptions.
Costs Do Not Always Behave Predictably
Fixed costs may increase when a business expands capacity.
Variable costs per unit may change because of bulk discounts, overtime wages or production inefficiencies.
Selling Prices May Change
Businesses may offer discounts or adjust prices in response to competition.
This affects contribution per unit and the break-even point.
Sales Mix May Vary
For businesses selling multiple products, changes in the proportion of products sold can alter overall contribution.
Production Capacity May Be Limited
A company may calculate that it needs to sell 5,000 units to break even but have capacity to produce only 4,000 units.
The break-even target would not be achievable without changing its operations.
Break-Even Does Not Mean Positive Cash Flow
Some accounting costs, such as depreciation, do not involve current-period cash payments.
Businesses may also face loan repayments, inventory purchases and delays in customer collections.
Therefore, accounting break-even does not necessarily mean the business has sufficient cash to meet every obligation.
Common Mistakes Students Make in Break-Even Calculations
Using Selling Price Instead of Contribution
The break-even formula uses contribution per unit, not selling price per unit.
Fixed costs are recovered from the amount remaining after variable costs.
Including Fixed Costs in Variable Cost per Unit
Fixed costs should be considered separately when calculating contribution and break-even volume.
Forgetting to Round Up Units
If the calculated break-even point is 666.67 units, the business must sell at least 667 whole units to avoid a loss.
Confusing Break-Even Sales with Target Profit Sales
Break-even sales produce zero profit.
Target profit sales must generate enough contribution to cover both fixed costs and the desired profit.
Ignoring Changes in Costs
A break-even calculation based on old cost information may no longer be reliable when raw material prices, rent or wages change.
Assuming Break-Even Guarantees Business Success
Reaching break-even means the business has covered the costs included in the analysis.
It does not automatically guarantee adequate cash flow, long-term sustainability or a satisfactory return on investment.
Why CA and CMA Students Should Understand Break-Even Analysis?
Break-even analysis is an important concept in cost accounting, management accounting and financial decision-making.
For CA students, it helps develop an understanding of cost behaviour, contribution, pricing decisions and profit planning.
These concepts are useful when studying marginal costing and analysing business performance.
For CMA students, break-even analysis is particularly relevant to budgeting, cost control, management reporting and operating decisions.
Management accountants may use cost-volume-profit relationships to evaluate sales targets, product profitability and changes in operating costs.
Commerce students can also use break-even analysis to understand how businesses determine minimum sales requirements and evaluate whether a proposed business idea is financially viable.
The central lesson is simple: a business breaks even when its total contribution is sufficient to cover its fixed costs.
Build Practical Cost Accounting Skills with Master Minds India
Break-even analysis helps students connect accounting formulas with practical business decisions. Understanding contribution, fixed costs, sales targets and margin of safety provides a strong foundation for studying cost accounting and management accounting.
Master Minds India provides educational resources for commerce students and aspiring CA and CMA professionals. Explore the available Master Minds courses to learn more about the educational programmes.
